
How to Tell if Your Venue Is Actually Making Money
Updated May 2026 · 9 min read · Evisory Hospitality Advisory

A full dining room doesn't automatically mean a profitable business. Learn how to track net profit, break-even points, and true margins.
📥 Free tools: Break-even Calculator · Profitability Tracker
A full dining room feels like success. A busy weekend feels like success. A bank account that hasn't dipped into overdraft this week feels like success.
None of these things mean your venue is actually making money.
This is one of the most common — and most painful — realisations in hospitality. Operators trading at solid volumes, turning tables, running a full team, building a following — and quietly losing money, or treading water so close to zero that one bad week tips them into loss.
The reason it's so easy to miss? A restaurant can be profitable on paper but still have cash flow problems. And it can have cash in the bank while quietly operating at a structural loss. These aren't the same thing, and conflating them is where most financial confusion in hospitality starts.
This post explains how to cut through that confusion — and the specific numbers that actually tell you whether your venue is making money.
According to the Australian Financial Review, out of every $30 spent at a café or restaurant, the operator makes an average profit of around 60 cents — roughly 2%. At those margins, the difference between a venue that's building wealth and one that's slowly going backwards is often invisible until it suddenly isn't.
First: the three numbers people confuse
Before getting to the diagnostics, it's worth separating three terms that get used interchangeably in hospitality — and shouldn't be.
Revenue is what comes in the door. It's your total sales across all channels: dine-in, takeaway, delivery, bar, events. A venue doing $1.5 million in revenue sounds healthy. Revenue says nothing about what's left after costs.
Gross profit is revenue minus the direct cost of making what you sold — your food and beverage costs (COGS). For financially viable restaurants, gross profit hovers around 70%, meaning for every $100 a guest spends, $70 is available to cover operating expenses. Strong gross profit is necessary but not sufficient — plenty of venues with 70% gross margins still lose money once rent, wages, and overheads are paid.
Net profit is what's actually left after every expense is paid — wages, rent, utilities, supplies, insurance, marketing, repairs, the lot. Full-service restaurants typically achieve net profit margins of 3–5%. Quick-service and fast-casual formats average 6–10% in stronger-performing cases. This is the number that tells you whether the business is genuinely working.
The gap between gross profit and net profit is where most venues lose their way — and where the actionable insight lives.
The profit vs cash flow problem

Cash in the bank and actual profitability are not the same thing.
Here's the scenario that trips up more hospitality operators than almost anything else.
You check your bank account on a Friday morning after a big weekend. There's money there. Feels good. But what that bank balance doesn't show you is: the BAS instalment due next week, the super liability that's been accumulating, the supplier invoice that was paid on Monday, and the payroll run that's processing on Thursday.
A profitable restaurant can have cash flow problems. And a venue sitting on cash can be structurally unprofitable. Cash is what's in the account right now. Profit is what's actually left when all obligations are met.
In hospitality, cash flow is a trailing indicator — a reflection of your profitability, not a driver of it. A venue with genuinely healthy margins generates consistent cash naturally. A venue with poor margins will eventually face cash pressure regardless of revenue volume — because there's simply not enough left over once all the costs are covered.
The practical implication: don't manage by bank balance. Manage by net profit percentage, prime cost, and break-even point. Those numbers tell you the truth.
The break-even point: your most important number

Knowing your break-even point changes how you run your venue.
Your break-even point is the revenue figure your venue needs to hit before it makes a single dollar of profit. Below it, you're operating at a loss. Above it, every additional dollar — minus variable costs — contributes to profit.
The break-even point is the amount of revenue needed to cover all operating costs without generating a profit or loss. It helps you make informed decisions about staffing, pricing, menus, and hours. When costs rise or sales fluctuate, it gives you clarity on what changes are necessary.
The formula:
Break-Even Point = Total Fixed Costs ÷ Contribution Margin Ratio
Where:
Contribution Margin = Total Sales − Total Variable Costs
Contribution Margin Ratio = Contribution Margin ÷ Total Sales
A practical example:
A café has $25,000 in monthly fixed costs (rent, insurance, salaried staff). Variable costs — food, casual wages, packaging — run at 44% of revenue. That means 56 cents of every dollar in sales contributes to covering fixed costs and generating profit.
$25,000 ÷ 0.56 = $44,643 monthly break-even point
Split across 26 open days, that's roughly $1,717 in daily sales before the business is turning a profit. Every dollar after the break-even point is profit. Knowing this number tells you exactly how many covers you need on a slow Tuesday to keep the lights on — and how many you need to actually put money in your pocket.
Download the Break-even Calculator to run this for your venue with your actual numbers.
What your break-even point is actually telling you
The raw number matters less than what it reveals about your cost structure. Here are the three things to read from it:
Your margin of safety. This is how far your actual revenue sits above your break-even point — expressed as a percentage. If your break-even is $44,000/month and you're consistently doing $52,000, your margin of safety is around 15%. If your normal sales volume is 3,500 coffees monthly and your break-even is 2,667, your margin of safety is about 24%. The larger the margin, the more resilience you have against a slow month, a cost increase, or an unexpected expense.
Your sensitivity to cost increases. Every time fixed costs go up — rent renewal, a new software subscription, a salary bump — your break-even point rises. A venue that's currently trading comfortably above break-even can find itself near it after a rent review, without anything else changing. Running this calculation quarterly means you're never surprised by a cost shift.
Whether your pricing is structurally viable. If your break-even point requires every seat filled every session to reach, the business model has a structural problem that marketing can't fix. The issue is either costs are too high or average transaction value is too low — and break-even analysis tells you which lever matters more.
The four signs your venue isn't actually making money
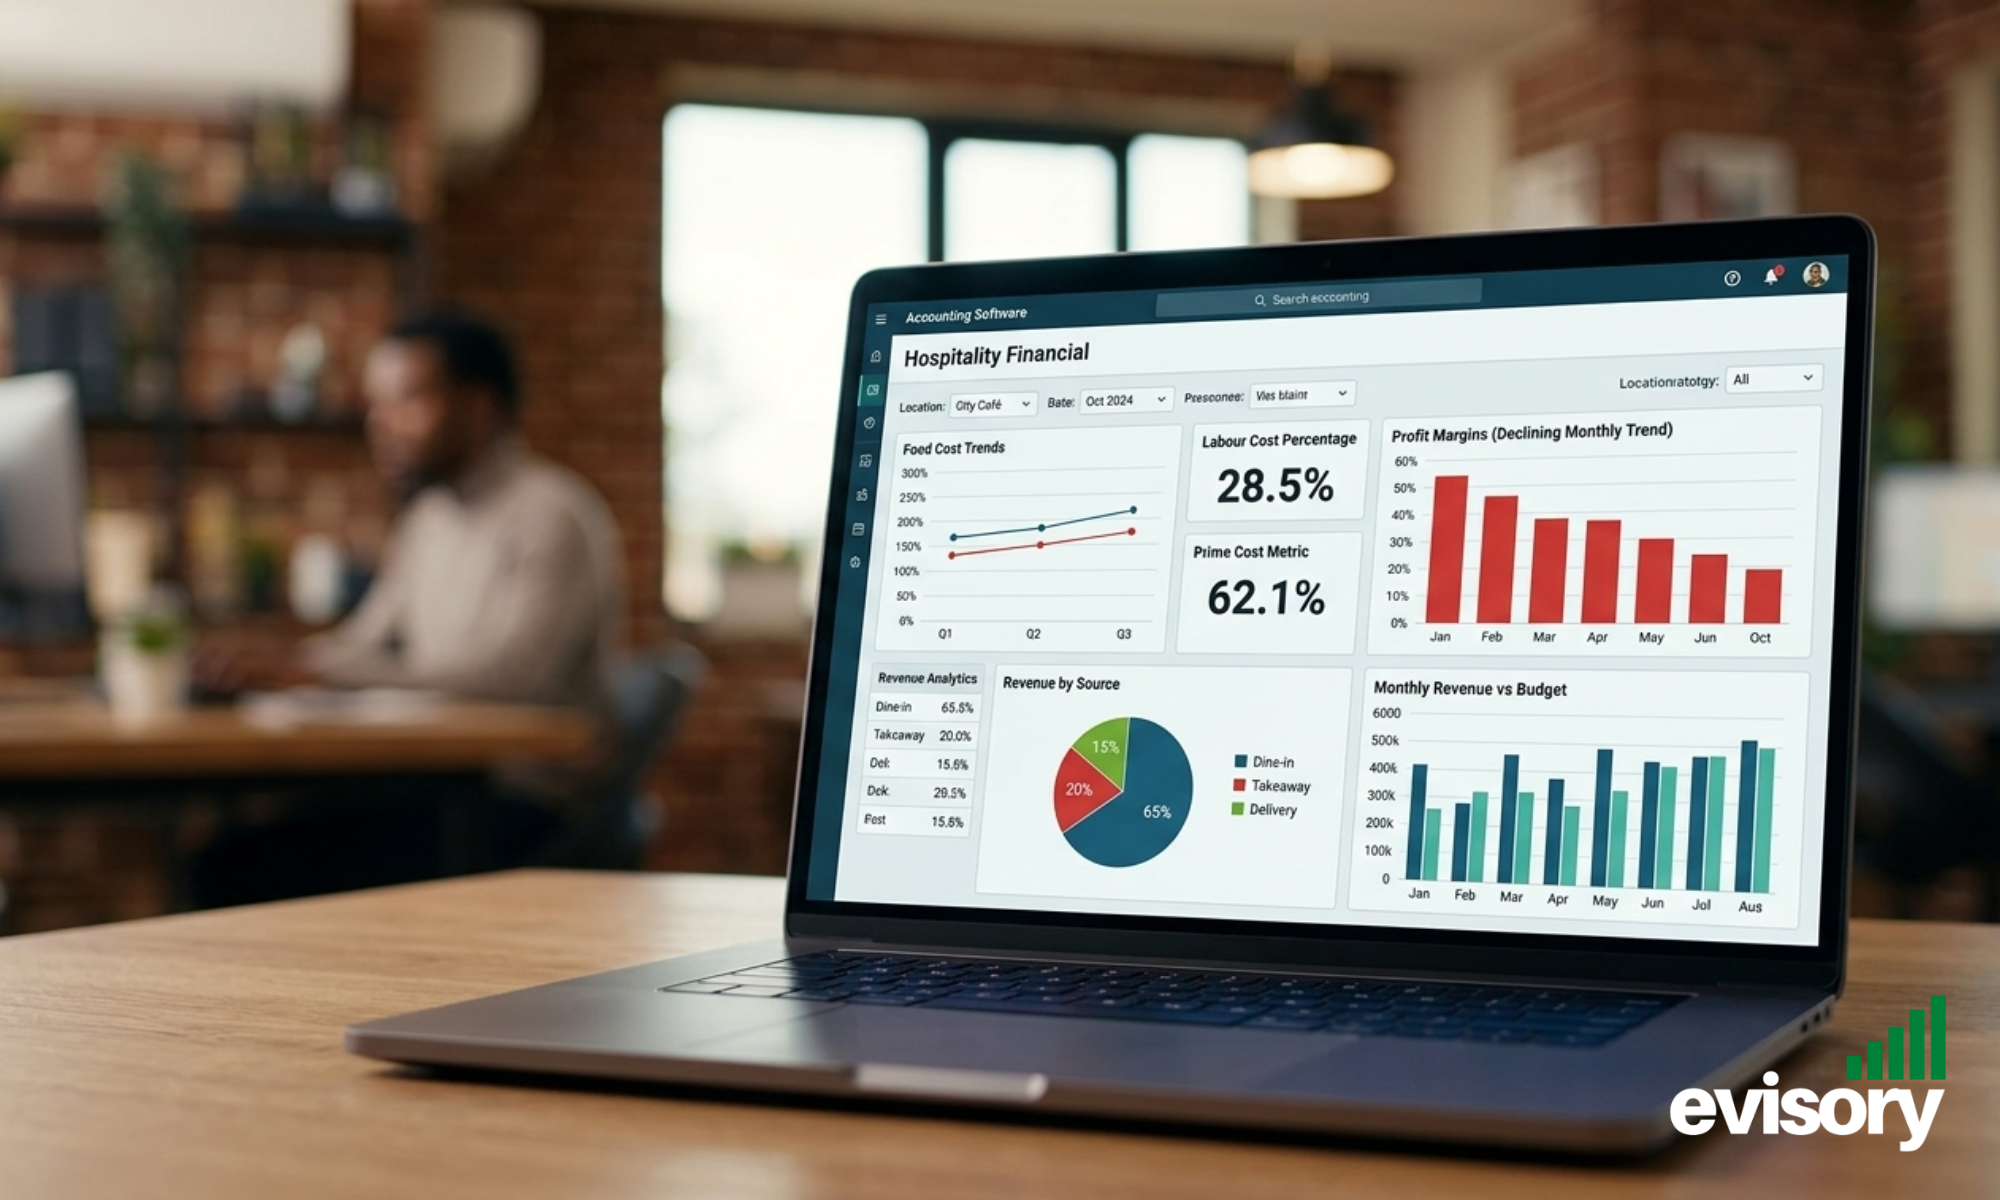
Profitability problems often appear first in the numbers.
Even if you don't have a break-even number ready, these four patterns are reliable signals that a venue's profitability is in trouble.
1. The bank balance varies wildly week to week with no clear reason.
Healthy venues have relatively predictable cash patterns — because their costs are known and revenue, while variable, tends to move within a range. Wild swings typically mean costs are unmanaged, revenue is highly seasonal without cash reserves to match, or money is being confused with profit. Cash flow problems that seem random often trace back to timing mismatches between when costs fall and when revenue arrives — which a cash flow forecast would have made visible.
2. The venue is busy but the owner isn't drawing a wage.
This is more common than it should be. A venue running at full capacity with a packed floor, but where the owner is not paying themselves a market wage, is not profitable — it's subsidised by the owner's labour. The P&L needs to include a realistic owner wage as a cost line. If removing that line is the only thing that makes the numbers look acceptable, the business is not viable at its current cost and pricing structure.
3. Labour or food cost is persistently above benchmark — and no one knows why.
Strong gross profit margins — often 65–75% on food and beverage — don't mean the restaurant is profitable overall. High labour costs, energy prices, or rent can quickly erode operating and net margins. When prime cost (labour + food) sits persistently above 65–70% without a clear reason — and without anyone tracking it weekly — it's a sign the business is running on feel rather than data. And feel, in hospitality, almost always drifts in the wrong direction.
4. Profit only appears in the good months — and disappears entirely in slow ones.
Seasonal swings are a reality in hospitality. But a venue that's genuinely profitable should generate positive margins in most months — even slower ones — and build reserves during strong periods to fund the lean ones. If profit only appears in November and December and the rest of the year is a wash or worse, the fixed cost base is too high for the venue's average revenue. That's a structural issue, not a seasonality issue.
How to calculate your actual net profit margin right now
If you've never done this calculation, here it is in plain terms:
Step 1: Take your total revenue for the last full month.
Step 2: Subtract your cost of goods sold (food and beverage costs). This gives you gross profit.
Step 3: Subtract all operating costs — wages, rent, utilities, insurance, marketing, repairs, subscriptions, owner's wage if applicable. This gives you net profit.
Step 4: Divide net profit by total revenue and multiply by 100. This is your net profit margin.
Example:
Monthly revenue: $120,000
COGS: $37,000 (31%)
Operating costs: $75,000 (wages $48,000, rent $14,000, utilities/other $13,000)
Net profit: $8,000
Net profit margin: 6.7% — healthy for a full-service venue
Now run it for your last three months. If the margin is consistent, your business is performing to a model. If it's erratic — jumping between 1% and 9% month to month — cost control is the issue, not revenue.
Use the Profitability Tracker to map this month by month and identify exactly where margin is being made or lost.
Profit by venue type: where should you actually be?
Venue TypeGross Profit TargetNet Profit BenchmarkRed FlagQuick Service / Takeaway65–72%6–10%Below 5%Café / Casual Dining65–70%4–7%Below 3%Full Service Restaurant65–72%3–6%Below 2%Fine Dining60–70%4–8%Below 3%Pub / Mixed Venue62–70%4–7%Below 3%
These aren't aspirational targets — they're benchmarks based on current industry data across 2025–26 reporting. Venues consistently sitting below the red flag threshold for their category need a structural review, not a marketing campaign.
The honest question to ask yourself

Long-term hospitality success comes from understanding the numbers behind the venue.
Here's the most direct way to assess whether your venue is making money:
If you paid yourself a fair market wage, paid all your suppliers on time, kept your super current, and put aside GST for every BAS — would there be money left over at the end of the month?
If the answer is yes, consistently: your venue is making money.
If the answer is no, or only sometimes, or you're not sure: the business has a profitability gap that needs to be understood and addressed. Not through more marketing, not through longer hours — through a clear-eyed look at costs, pricing, and break-even.
The restaurants that thrive long-term aren't just the ones with the best food or the best vibe. They're the ones where the owner knows their numbers — and acts on them.
Download the Break-even Calculator to find your number, and the Profitability Tracker to monitor your margins month by month.
Further reading
Restaurant365 – How to Calculate a Restaurant Break-Even Point
Profitability Partners AU – Profitability vs Cash Flow in Hospitality
Back Office – Cash Flow vs Profit: Why Restaurants Need Both
Not sure where your venue sits?
Evisory works with Australian hospitality operators to build a clear picture of profitability — and a practical path to improving it.