
The 5 Hospitality Numbers Every Venue Owner Should Track Weekly

Master the five critical weekly numbers every hospitality venue owner needs to track to improve profitability and cash flow.
Most venue owners check their bank balance and call it a day. But the businesses that thrive long-term? They're watching five specific numbers — every single week.
Running a hospitality venue is one of the most operationally complex businesses there is. You're managing perishable inventory, variable labour, fluctuating covers, supplier relationships, and a customer experience — all at once.
Yet when we ask most venue owners what numbers they track weekly, the answer is usually: "I look at revenue, and I try to keep an eye on the bank."
That's not enough. According to IBISWorld's hospitality research, thin margins and poor cost visibility remain the leading operational risk for Australian venues. It's often why profitable-looking venues still run out of cash.
Here are the five numbers that actually tell you how your venue is performing — and what to do when they start drifting.
1. Prime cost ratio
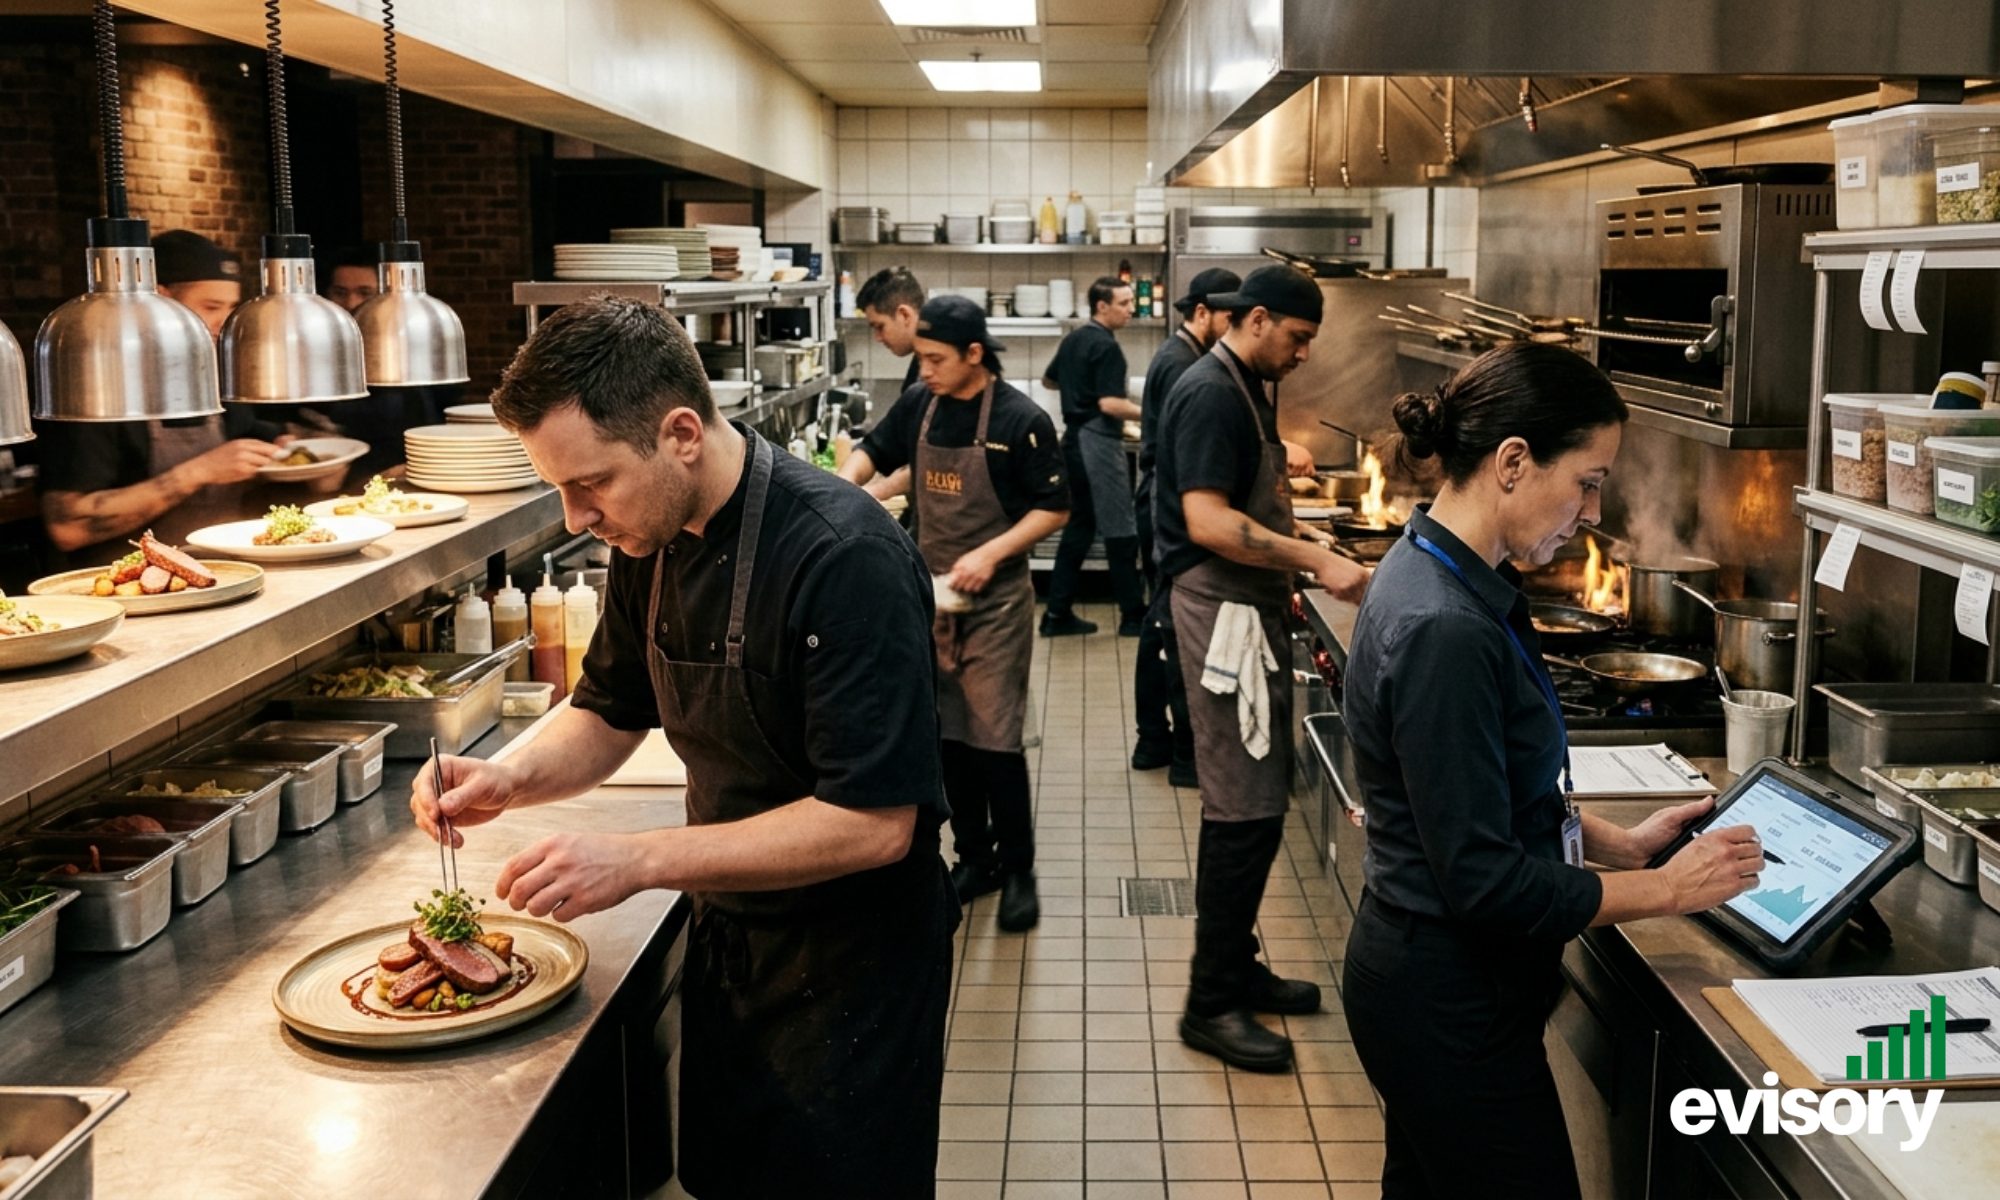
Prime cost combines labour and cost of goods sold to measure venue efficiency.
Prime cost is your two biggest expenses combined: cost of goods sold (COGS) + labour cost. Expressed as a percentage of revenue, it tells you how efficiently you're converting sales into margin.
A healthy prime cost ratio for most venues sits between 55–65%. According to Toast's hospitality benchmarking guide, venues running above 65% are almost always experiencing margin pressure they haven't yet identified. If yours is creeping above that, you're either over-staffing, over-ordering, or under-pricing — and you need to know which one before you can fix it.
Benchmark
Restaurants: aim for ≤60%. Bars and venues with low food volume: ≤55% is achievable. Cafés: 60–68% is typical given high labour relative to revenue.
2. Food & beverage cost percentage
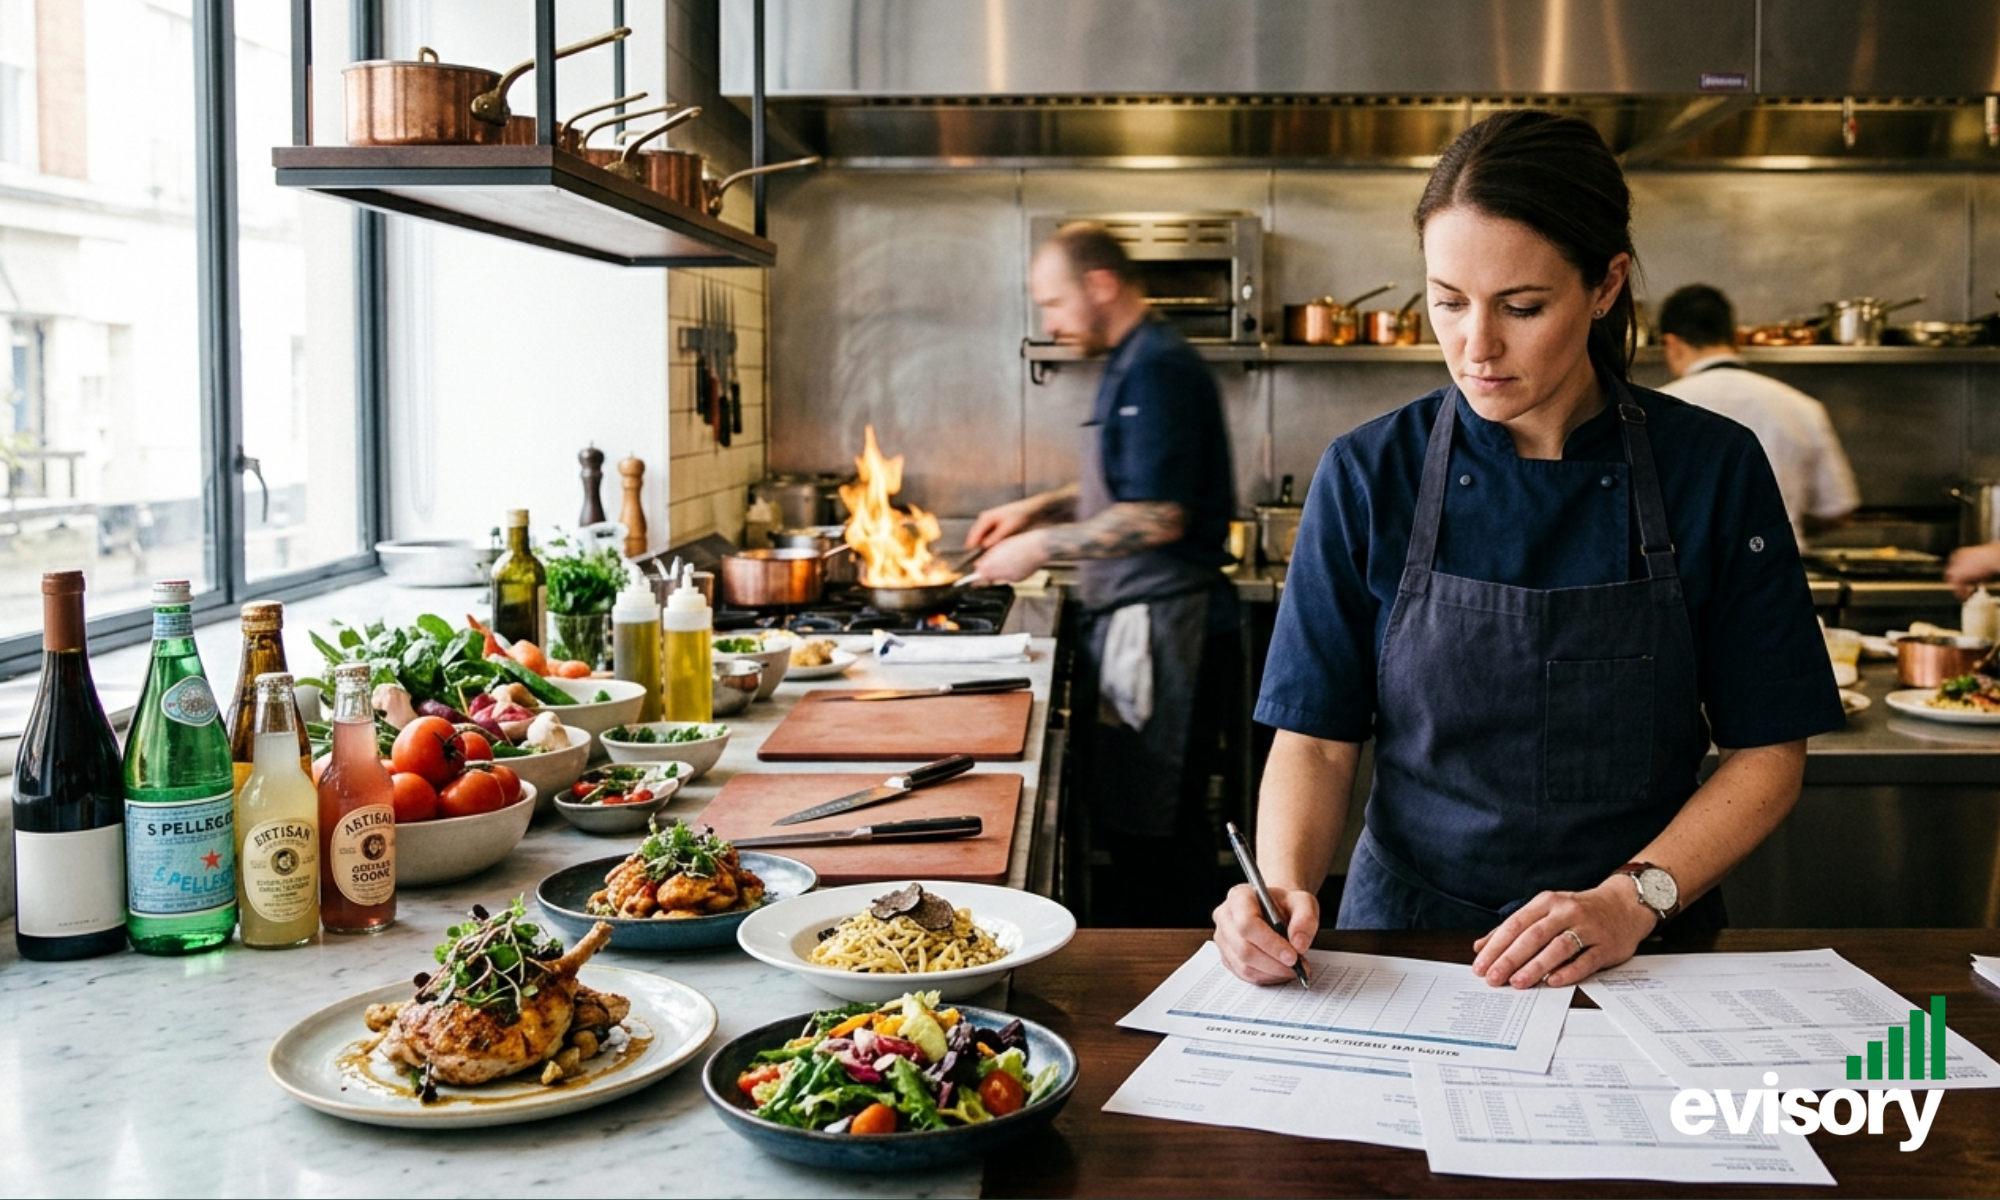
Weekly food and beverage cost tracking helps venues reduce waste and protect margins.
Your COGS as a percentage of food and beverage revenue. This reveals whether your menu is priced correctly and whether your kitchen is managing waste. The Restaurant365 food cost guide recommends tracking this weekly rather than monthly — a monthly view smooths over the weeks where a supplier charge landed awkwardly or a function overspent on produce.
Target: Food cost 28–35% · Beverage cost 18–25%
3. Labour cost percentage

Labour cost percentage is one of the most important hospitality profitability metrics.
Labour is typically the most variable and most manageable of your major costs — but only if you're watching it in near real-time. Total wages (including super and on-costs) as a percentage of revenue should be reviewed against your weekly roster before the pay run, not after.
The trap here is comparing labour cost in dollar terms rather than percentage terms. A $12,000 labour week looks very different against $40,000 in revenue (30%) versus $28,000 in revenue (43%). Fair Work's hospitality award rates are also worth keeping bookmarked — casual on-costs are frequently underestimated.
4. Weekly gross profit

Gross profit reveals whether a venue’s core trading activity is financially healthy.
Revenue minus COGS — before labour, rent, utilities, and everything else. Gross profit tells you whether the core trading activity of your venue is viable. If gross profit is strong but net profit is weak, your problem is overhead. If gross profit is weak, your problem is product: pricing, waste, or supplier costs.
Understanding which bucket your problem lives in completely changes the solution.
5. Cash position vs. forecast

Cash flow forecasting helps hospitality venues avoid unexpected financial shortfalls.
Not just "what's in the bank right now" — but whether that number is where you expected it to be. A 13-week rolling cash flow forecast lets you spot shortfalls four to six weeks before they arrive, giving you time to act. The Australian Government's Business.gov.au notes that cash flow mismanagement is the number one reason otherwise viable small businesses fail. Venues that get blindsided by cash shortfalls are almost always venues that weren't forecasting.
What does "tracking" actually look like?

Weekly KPI tracking helps hospitality businesses make faster and smarter decisions.
For these metrics to be useful, they need to be:
Timely — available within 1–2 days of the week ending, not weeks later
Consistent — calculated the same way every week so trends are meaningful
Benchmarked — compared against your own historical data and industry targets
Actionable — linked to a decision, not just a number on a spreadsheet
That's why we built three free tools below — so you can start tracking the right numbers this week, not next quarter.
Free Hospitality KPI Calculator
Plug in your weekly numbers and instantly benchmark your venue performance — no spreadsheet expertise required.
Numbers off and not sure where to look? The Evisory team works with hospitality venues on operational bookkeeping, management reporting, and cash flow advisory. Get in touch with us →