
What Healthy Hospitality Numbers Actually Look Like in 2026
Updated May 2026 · 10 min read · Evisory Hospitality Advisory

Track the key financial benchmarks—from labour cost to net profit—that separate profitable hospitality venues from struggling ones.
There's a version of running a hospitality venue where you pour everything into the guest experience and hope the books sort themselves out. Most operators know that version well. It's exhausting — and financially fragile.
The alternative is knowing your numbers. Not just having them, but understanding what healthy actually looks like for your venue type, your market, and 2026's cost environment. This post breaks down the benchmarks that matter, where Australian venues are landing right now, and what separates the operators holding margin from those slowly losing it.
📥 Free tools:
Why 2026 is different: Australia's foodservice sector turned over more than $66 billion in FY2025 — but modest revenue growth has been largely swallowed by rising wages, energy costs, and supply chain pressure. Knowing where you sit against benchmarks has never mattered more.
The four numbers every venue owner needs to know
Before diving into benchmarks, it's worth being clear on which metrics actually drive profitability decisions. The four that matter most in hospitality are: labour cost percentage, food cost percentage, prime cost, and net profit margin. Everything else flows from these.
Labour Cost % — Target: 28–35% of revenue Under 30% is strong. Over 38% is a warning sign.
Food Cost % — Target: 28–35% of food revenue Fine dining may push to 35%. QSR should aim for 28–32%.
Prime Cost — Target: Under 65% Labour + COGS combined. Above 70% leaves almost nothing for rent and overheads.
Net Profit Margin — Reality: 3–9% Full-service: 3–6%. QSR and fast-casual: 6–10%. Below 3% is critical.
Labour cost: the benchmark that's moved the most

Labour efficiency is one of the biggest drivers of venue profitability.
Labour is almost certainly your largest cost. And in 2026, it has gotten harder. Australia's National Minimum Wage rose to $24.95 per hour on 1 July 2025 — and that's before penalty rates, superannuation, and the true cost of roster inefficiency. Wage growth is running at around 3.4% year-on-year as of December 2025.
The industry benchmark for labour cost sits between 28% and 35% of revenue. But the range matters as much as the number: a café running lean systems and consistent covers can hold 28–30%. A full-service restaurant with complex menus and inconsistent covers will often drift toward 35% or beyond, particularly on weekday services.
What good labour management actually looks like
The operators consistently holding labour under 32% tend to share a few habits: they roster based on forecasted revenue (not habit), they track labour cost weekly rather than monthly, and they distinguish between productive and non-productive labour time. Staff training, cleaning, and admin time are still labour cost — they're just the part that's easiest to let expand without noticing.
If your labour cost is above 35% in a week where covers were solid, the problem is almost never "we need to charge more." It's usually a rostering gap, an overtime spike, or a prep inefficiency. Use the Labour Cost % Calculator to identify exactly where the blowout is happening.
Food cost percentage by venue type
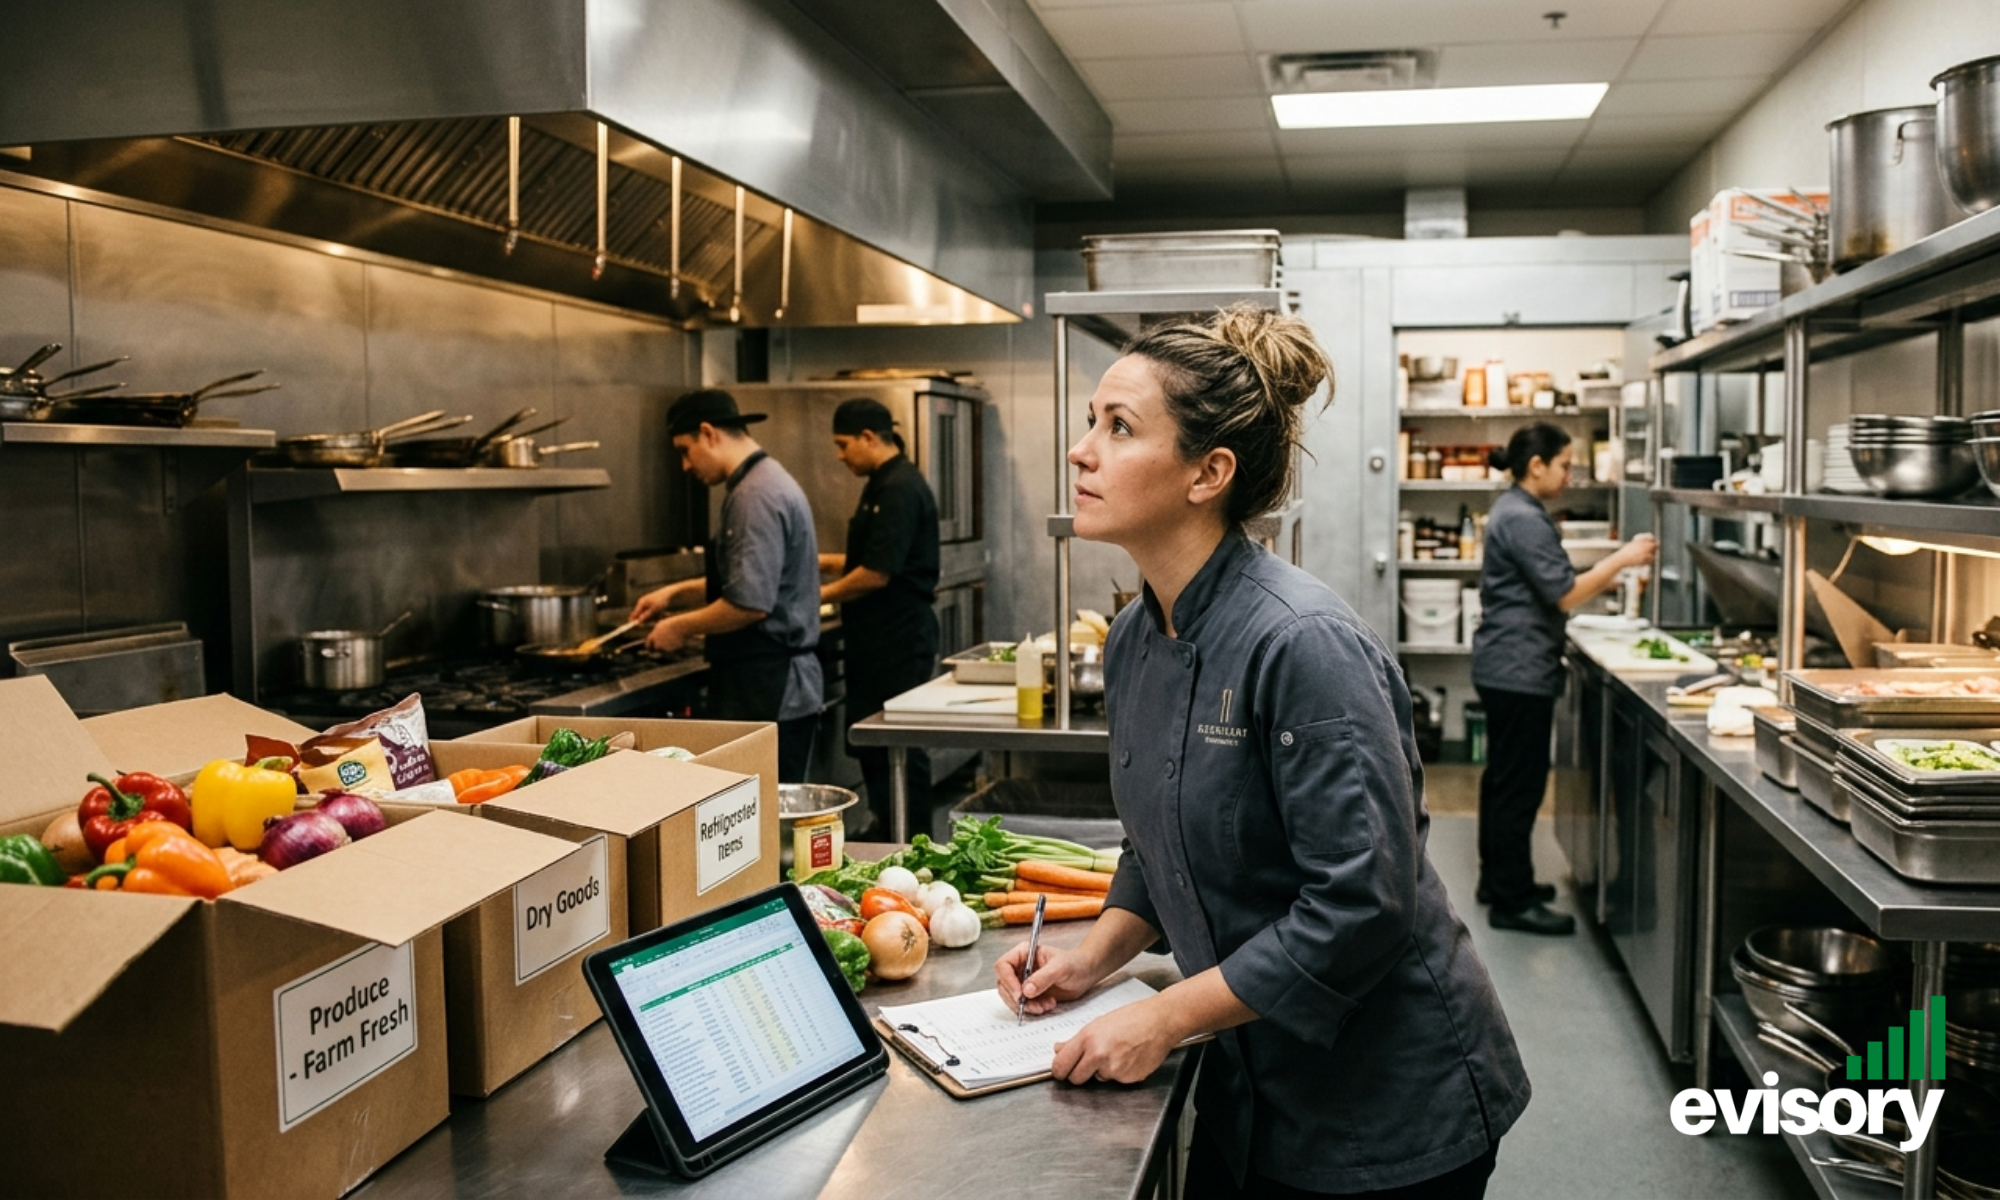
Small improvements in food cost can significantly improve net profit.
Food cost — the cost of ingredients as a percentage of food revenue — is the second pillar of hospitality financial health. According to NetSuite's restaurant benchmarks, average COGS should sit at 30% or below, with non-alcoholic beverages at 15% or below, and alcohol ranging 18–40% depending on the mix of spirits, beer, and wine.
Venue TypeFood Cost % BenchmarkBeverage Cost %Quick Service / Takeaway28–32%10–15%Casual Dining / Café29–33%14–20%Full Service Restaurant30–35%18–28%Fine Dining32–38%20–35%Pub / Venue (mixed)30–36%18–32%
If your food cost is persistently above the top of your category's range, the three most common culprits are: over-portioning, waste that isn't being logged, and supplier pricing that hasn't been reviewed in 12+ months. A 1–2% improvement in food cost can materially move your net margin — in an industry where margins are typically single-digit, that's a meaningful gain.
Prime cost: your single most important combined metric

Prime cost gives the clearest snapshot of operational health.
Prime cost is labour cost plus cost of goods sold (COGS). It's the clearest single snapshot of operational health because it captures your two biggest variable costs together.
The target for a healthy hospitality venue is prime cost below 65% of revenue. A venue sitting between 65–70% is under margin pressure but can survive with tight overhead management. Above 70%, the business is structurally exposed — because combined with operating costs, total expenses can easily reach 85–90% of revenue, leaving almost nothing before interest, depreciation, and tax.
A healthy full-service venue breakdown (example):
Food cost: 31%
Labour: 31%
Prime cost combined: 62% ✓
Overheads: 18%
Net profit: ~6%
Net profit margin: what's actually realistic in 2026
Here's the uncomfortable truth: the average net profit margin for a full-service restaurant is 3–6%. For quick-service and fast-casual formats, it ranges from 6–10% in stronger-performing cases. Independent operators often fall slightly below these benchmarks due to scale and purchasing constraints — which is why understanding and actively managing the above metrics matters so much.
These margins mean a venue turning over $2 million annually is retaining $60,000–$120,000 in net profit if running well. A single staff scheduling inefficiency, a supplier price rise absorbed without a menu adjustment, or a waste problem left unaddressed for a quarter can wipe that out entirely.
The 2026 consumer context: Australians are dining out around 12% less frequently than pre-2020 — but spending more per occasion when they do. Venues that have adjusted pricing to reflect true cost without sacrificing quality are holding margin better than those discounting to drive frequency.
KPI benchmarks beyond the basics
Financial percentages tell you the health of the business. Operational KPIs tell you why.
KPI Healthy RangeWarning ZoneTable turnover rate (FSR)2.5–3.5x per serviceBelow 2xAverage transaction valueGrowing with inflationFlat or decliningCovers per labour hour4–6 (casual dining)Below 3Inventory days on hand3–5 daysAbove 7 daysStaff turnover (annual)Below 60%Above 80%Online ordering % of revenue20–40% (urban)0% = missed channel
Over 70% of Australian consumers now order food online at least once per month, and delivery and takeaway can account for 20–40% of urban venue revenue. Venues without a functioning digital ordering channel are leaving a significant revenue stream untapped.
What the industry landscape is telling us right now
Independent venues are under structural pressure
For the first time in recent history, the proportion of chain restaurants in Australia has ticked from 23% to 24% — a small move, but potentially significant. Independent operators who don't build operational discipline around benchmarks and KPIs are competing at a real disadvantage.
Menu rationalisation is working
More than half of Australian restaurants reduced their menu size in 2025, and operators who cut by 20% or more saw real improvements in cost control and speed of service. A tighter menu is easier to cost accurately, reduces prep waste, and shortens training time — all of which flow directly into better cost percentages.
Technology has crossed from optional to expected

Digital reporting is now essential for modern hospitality operations.
74% of Australian restaurants now use a cloud-based POS system, and 61% say digital reporting has improved their decision-making. If you're not reviewing labour and COGS data weekly, you're making decisions with one hand tied behind your back.
A simple self-audit: where does your venue sit?
Pull your last three months of data and work through these:
Labour cost above 35%? Start with your roster. Are you staffing to habit or to forecast? Are you tracking hours against revenue daily or weekly?
Food cost above your category benchmark? Run a quick waste log for two weeks. Then pull your last three supplier invoices and compare pricing on your top 10 ingredients.
Prime cost above 65%? If both labour and food are in range, check your menu mix. If one is out of range, that's where to focus first.
Net margin below 3%? This is a structural problem, not a marketing one. Discounting or driving more covers without fixing cost structure typically makes things worse. You need a clean-sheet view of your P&L — and likely outside eyes on it.
Access the Venue KPI Scorecard to walk through this audit in a structured format, or use the Benchmark Calculator to plug in your own numbers against industry ranges.
Ready to benchmark your venue?
Our team works with Australian hospitality operators to identify exactly where margin is being lost — and build a practical plan to recover it.