
Why Most Hospitality Venues Don't Know Their Real Profit Margin

Uncover the difference between gross revenue and true net profit margin to protect your hospitality venue's bottom line.
Revenue is vanity. Profit is sanity. But in hospitality, even your "profit" number can lie to you — if you're not calculating it correctly.
You've had a strong month. The bookings were solid, the bar did well, and the POS report is showing healthy turnover. So why does it feel like there's never quite enough cash left over?
If this sounds familiar, you're not alone — and you're probably not tracking your real profit margin.
Most venue owners know their top-line revenue. Far fewer know their actual net margin after food costs, labour, rent, utilities, repairs, marketing, and the dozen other line items that quietly erode it. According to IBISWorld's Australian hospitality industry data, net margins across the sector average just 3–9% — meaning the gap between a thriving venue and a struggling one often comes down to cost visibility, not revenue.
Here's why most venues get this wrong — and what to do about it.
The numbers most venues are (and aren't) tracking
3–9% - Average net profit margin for hospitality venues
60%+ - Of venues report tracking revenue but not margin
#1 Cash flow failure is the top reason small businesses close
In a thin-margin industry, the difference between a profitable venue and a struggling one often isn't revenue — it's cost visibility. Knowing exactly where your dollars are going, and catching the leaks early.
The three margin mistakes venues make most often
Common calculation errors and what they cost you
What venues do
Subtract only food and beverage costs from revenue and call that "profit"
What it should be
Gross profit minus labour, overhead, rent, and all fixed costs = true net margin
Use end-of-month P&L to make weekly operational decisions
Track prime cost and margin weekly so you catch drift before it compounds
Treat all revenue the same — dining, functions, bar, catering lumped together
Segment revenue streams to understand which parts of the business are actually profitable
Why gross profit and net profit tell different stories

Overhead expenses can quietly reduce strong gross margins into weak net profits.
Your gross profit margin is revenue minus the direct cost of goods sold — food and beverage. It tells you whether your menu is priced right and whether your kitchen is managing waste well. The Restaurant365 food cost guide recommends a food cost target of 28–35% and beverage at 18–25%.
Your net profit margin is what's left after everything: labour, rent, utilities, insurance, marketing, repairs, professional fees. This is the number that tells you whether the business is actually viable.
A common trap: a venue has a solid gross margin of 68% but a net margin of 2% — meaning overhead is quietly consuming almost all of what the kitchen produces. If the owner is only watching gross margin, they feel like they're doing fine. The bank account tells a different story.
Watch out for this
Labour is the most common hidden margin-killer. Many venues calculate food cost carefully but undercount labour — missing casual hours, overtime, and on-costs. The Fair Work hospitality award requires superannuation and casual loadings that frequently go uncounted. Your real labour cost is almost always higher than it first appears.
What prime cost has to do with it
Prime cost — your COGS plus total labour — is the single most powerful lever in hospitality profitability. Because it represents the two largest and most controllable costs in the business, it gives you a compressed view of operational efficiency. Toast's prime cost benchmarking is a widely referenced standard across the industry.
If your prime cost is running above 65% of revenue, you're almost certainly not hitting a healthy net margin — regardless of how strong your top line looks.
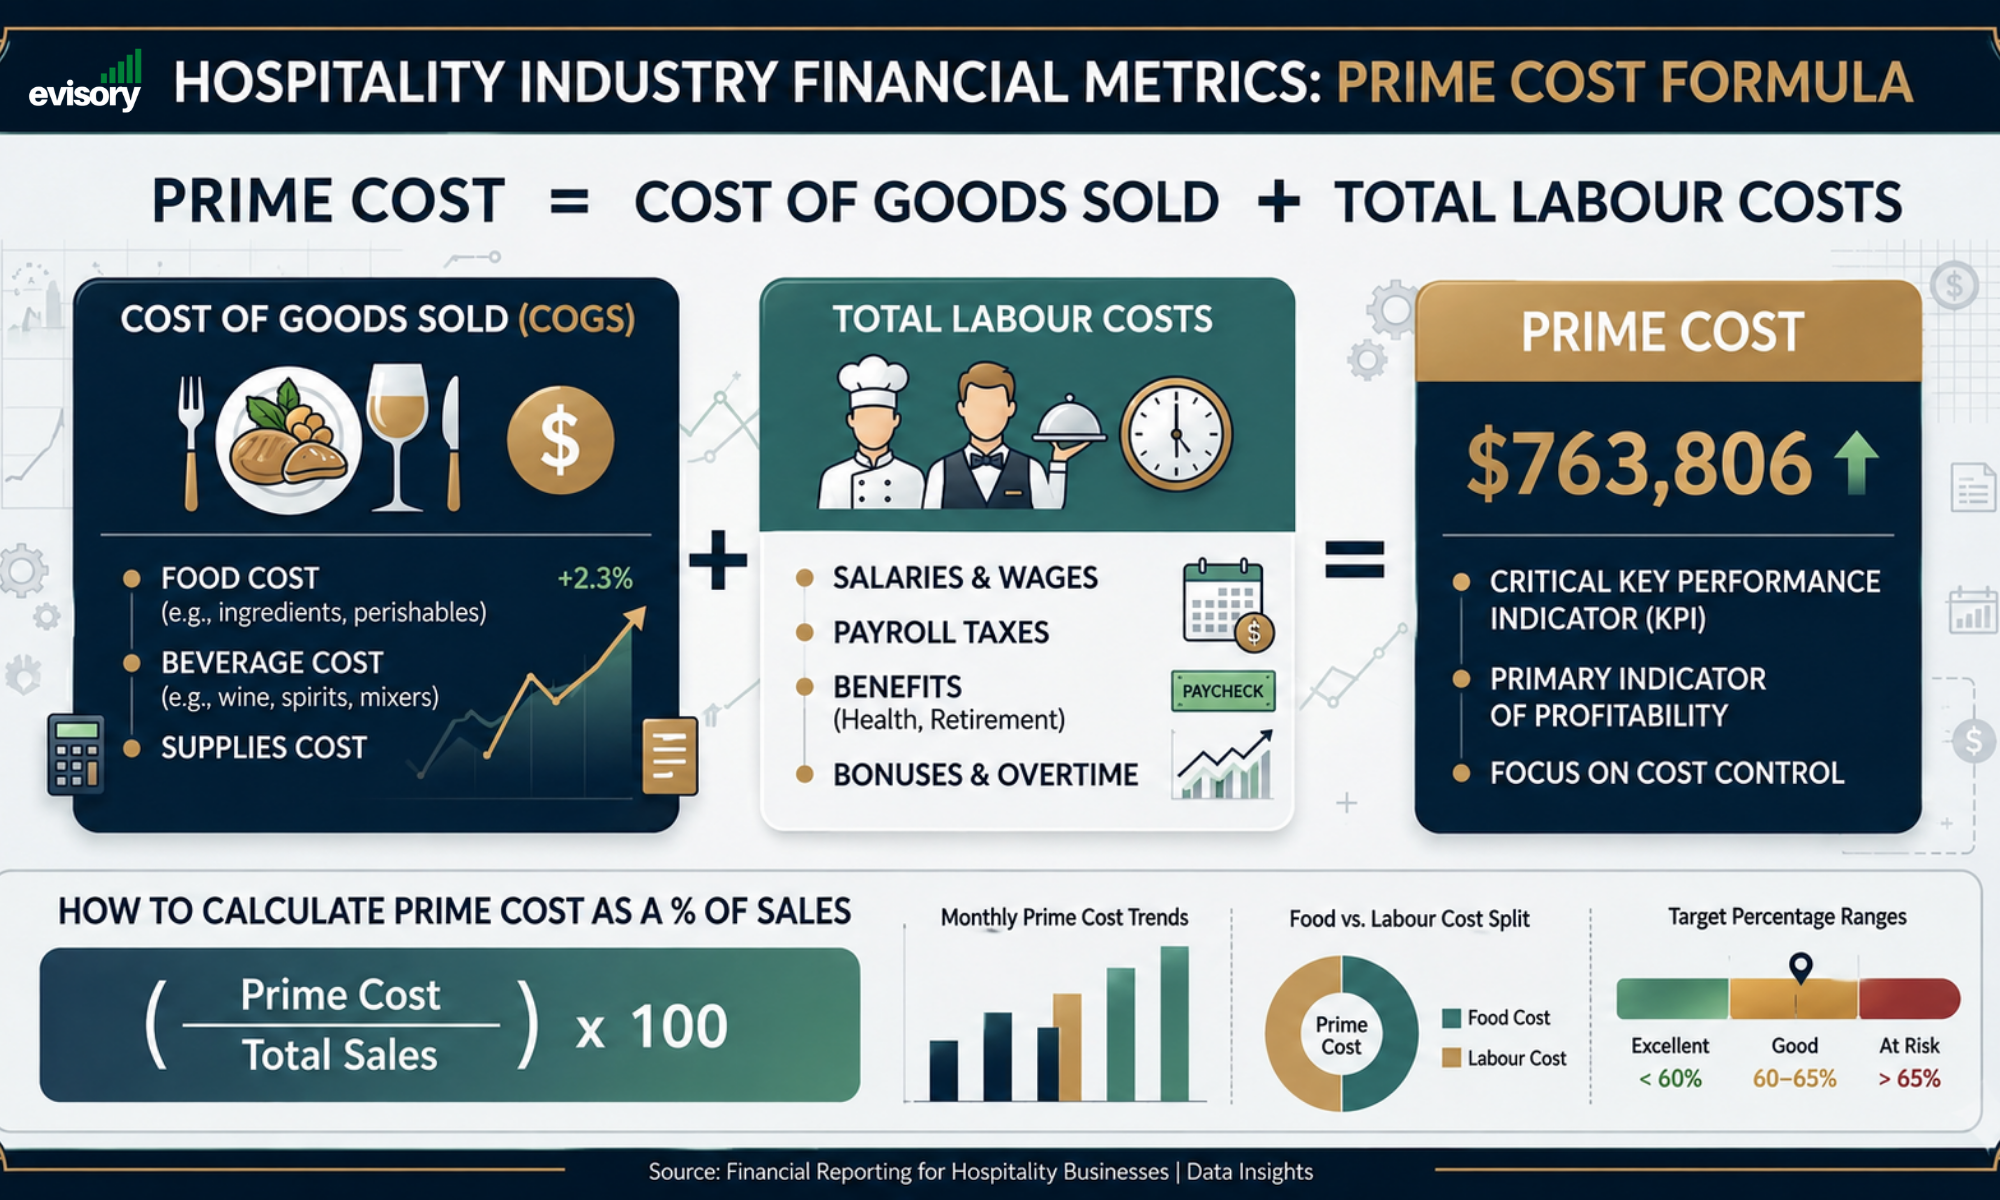
Prime cost is one of the most important hospitality profitability metrics.
The prime cost formula
Prime Cost = Cost of Goods Sold + Total Labour Costs
Prime Cost % = Prime Cost ÷ Total Revenue × 100
Target: below 65% for most full-service venues. Below 60% for high-volume or simple-menu operations.
How to actually calculate your real profit margin
Start with total revenue — including food, beverage, functions, and any other income streams
Subtract COGS — opening stock + purchases − closing stock, calculated separately for food and beverage
Subtract total labour — all wages, casual and salaried, plus super, payroll tax, and on-costs
Subtract all fixed and variable overhead — rent, utilities, insurance, marketing, repairs, professional fees
What's left is your net profit — divide by revenue and multiply by 100 for your net margin percentage
Done weekly, this takes about fifteen minutes with the right template. Done monthly from your accountant's P&L, it's too late to change anything. Business.gov.au's cash flow guide outlines why weekly visibility is critical for small business survival.
That's the difference between reporting and managing.

Better financial visibility helps hospitality venues improve long-term profitability.
Start with the right tools
We've built three free calculators to help you get clear on your numbers — starting this week.
Free downloads for venue owners
Plug in your numbers and know exactly where you stand — no spreadsheet expertise required.
If your margin numbers are off and you're not sure where to look, the Evisory team can help. We work with hospitality businesses on cost analysis, management reporting, and operational bookkeeping. Get in touch with us →